Headlines, meet sparklines: news in context
News reporting suffers from two major issues I'd like to tackle. The first is a bias towards negative, emotionally laden events. The second is the difficulty of capturing information about gradual changes.
These two deficiencies distort our perception. They make it easy for demagogues to claim that the world has gone to shit. The data tells a different story, as the late Hans Rosling was fond of reminding us. My hypothesis is that if base rates were provided in a compelling way alongside news stories (or even headlines), the public would be better informed. The challenges are many: first, getting and analyzing the data, but even more important, presenting it in a reasonable way.
In this post, let's explore what that would entail, from data collection, to analysis, to visualization. We'll go through a couple of examples.
The problems with news
I've already complained about the news in a previous blog post, but this time around, I'd like to hone in on two specific issues: negativity and gradual changes:
-
News is generally biased toward negative, emotionally laden events. A terrorist rampage that claims five victims is practically guaranteed to make the front page, while a cure that saves five hundred certainly wouldn't.
-
News does not inform about gradual changes. Many important processes, such as climate change, are gradual. Like boiling a frog, there are no specific events to report on, so they get no coverage in the news (until the frog dies).
The goal here is for perception to approach reality. I will assume that you agree with me that this is a worthy goal to pursue. Otherwise, we now return you to your regularly scheduled program.
Headlines invite questions
I went through some recent news stories (on Wikipedia), asking some simple questions. For example:
| Headline | Questions |
|---|---|
| The death toll from the Rigopiano avalanche rises to 29. | How frequent are avalanche deaths? What about just in Italy? What are some big recent avalanches? |
| Ken Wyatt is sworn in as the first Indigenous Australian to serve in Australia's cabinet. | What is the population of Indigenous Australians? What is the racial breakdown in Australia's cabinet? What about other countries? What about historically? |
| The Kremlin arrests four people, one from Kaspersky Lab and three from the Federal Security Service, reportedly on treason charges for passing information to America's CIA. | How many arrests does the Kremlin typically make? How many for treason? How about the US government? |
Firstly, to even ask the question requires a skeptical mindset. Secondly, finding the data requires time and research. Lastly, presenting the data in a compelling way takes some thought and creativity. Keeping in mind that I make no claims to any of the above, let's give it a shot.
Why are base rates important?
The questions above attempt to get at the base rates relevant to the news stories, which is important context to get a better understanding:
It may at first seem impressive that 1000 people beat their winter cold while using 'Treatment X', until we look at the entire 'Treatment X' population and find that the base rate of success is actually only 1/100.
It is also well known from a large number of psych studies that people are really bad at integrating base rates into their thinking. Maybe this is why they are so rarely featured in the news? My hope is that by pairing each headline with a bit of base rate information, we can become better informed and address both negativity and get a better sense for trends over time.
Exhibit A: avalanche deaths (time series data)
Let's start with a simple quantitative (if morbid) example: Avalanche deaths. We can better understand just how extreme the Rigopiano avalanche was if we put it into context. But what sort of context makes sense? If we consider geography, we can imagine concentric circles around Rigopiano.

On one extreme, we could consider other avalanches at Rigopiano specifically. But for most people, especially outside of Italy, this is too specific. Expanding our search, we could consider all of the Apennines (the mountain range containing Rigopiano), but I found that getting data for avalanche fatalities in this region was challenging. The outermost circle of the map above represents the European Alps, which does not include the Apennines. But it is the geographically closest region with readily available data.
This spreadsheet contains data that I extracted from Avalanche fatalities in the European Alps: long-term trends and statistics, which includes contiguous coverage from 1970 to 2015. Naturally, the paper didn't link to a data set, so I had to create the spreadsheet by visually inspecting the graph (ouch).
The paper contains some interesting findings. For example, the number of avalanche deaths in controlled terrain (eg. ski resorts, where ski patrol engages in avalanche control tactics) has decreased significantly, but that the number of avalanche deaths in uncontrolled terrain remains significant (in the Alps, 100 yearly) and stable. Note that the numbers are not adjusted for the increasing global population, or for the increasing numbers of back country tourists.

One of the things that becomes clear is the important distinction between controlled and uncontrolled accidents. We now have context for better understanding the tragedy at Rigopiano: it was a controlled accident that will send the statistics for 2017 through the roof. Let's see it in the context of other significant avalanches (controlled and not) over the years. The following claimed more than 20 people since 1970, according to Wikipedia:

Now we are armed to the teeth with data, but how do we present inline in the news? There are tons of ways of visualizing data in a compelling way, but in this case we want it to appear in-situ in a digital newspaper. Why not start with Tufte-inspired sparklines, since they are compact and can be placed adjacent to a headline.
From the first graph, we can immediately see that significant avalanches are rare, so this event is definitely newsworthy, but didn't claim as many lives as some of the most fatal ones, even recently. The second sparkline shows that avalanches on controlled terrain (in the Alps) claim fewer lives, which makes Rigopiano even more significant. Then, to satisfy our curiosity, the third sparkline shows annual avalanche fatalities on uncontrolled terrain is persistently high (c. 100 yearly). We now have some context to better understand this story.
A quick note on technology. The above is a slightly modified version of Spark
SVG. I added a few things to the basic bar.svg:
- Set y-axis scale for fair comparisons across different graphs.
- Labels (x, y) values on hover.
- Ability to transpose the graph.
As an aside, I was amused to discover the Canadian Avalanche Association Markup Language (CAAML), which is a "standard for the electronic representation of information pertinent to avalanche safety operations". I had naively hoped to one day escape XML by becoming a ski bum. Not so fast!
Exhibit B: cabinet composition
Let us now turn our attention to Ken Wyatt, the newly appointed member of the Australian cabinet. How ethnically diverse is the Australian cabinet? At minimum, we can look at base rates for ethnicity in the Australian cabinet. In 1997, the cabinet was 100% white, but now with Wyatt's joining, the cabinet is 96% white (he is the only non-white member). Not much to visualize yet, so let's expand our scope.
Consider three metrics: % female, % non-white and % non-christian for each cabinet, and compare them across three cabinets: US, Australian and Canadian, between two years: 1997 and 2017. I've collected this data in a spreadsheet. It was a fair amount of work to skim Wikipedia pages for six sets of cabinet members to try to gleam gender (easy), ethnicity (tricky) and religion (hard). While there are surely mistakes in the spreadsheet (please email me if you find one), it should be good enough for broad strokes. My own position would favor a qualified cabinet over a diverse one, but all things being equal, a cabinet that is representative of the general population is a good thing. Here's the headline with data alongside:
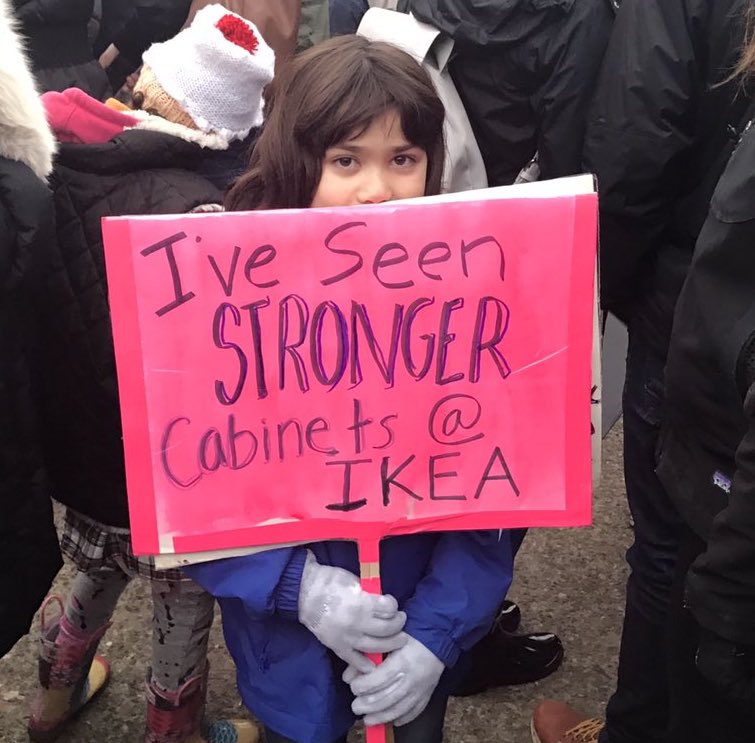
To summarize, I've seen stronger cabinets at IKEA!
One thing that is clear from the above is that indeed, Australia has a very white cabinet. Of course, in the spirit of representation, we should be comparing ethnicity numbers to the general population, but I'll leave that out for now (for reference, 3% is indigenous, and ~10% is non-white).
Another thing the chart above shows are trends over the 20 year period. Australia's cabinet is becoming more female, while staying roughly as white and as Christian. Canada's cabinet has become vastly more representative in gender, ethnicity and religion. In stark contrast to Canada, the US has actually regressed in diversity on all fronts. Over the last 20 years, its has become more male dominated, more Christian, and more white. The last is especially disappointing since the US is far more ethnically diverse than Canada and Australia put together (at "just" 72% white).
I should mention a couple caveats. First, I really fudged the % Christian calculations, since it was so difficult to accurately determine religion for many cabinet members. Also, this analysis would greatly benefit from more data points. For example, Clinton's cabinet in 1997 was quite diverse but probably became even more diverse under Obama, but that data point is missing. Getting additional data points for Canadian and Australian cabinets is more challenging, since there are no term limits, and cabinet members flow more freely in and out, change roles inside them, and sometimes even hold multiple offices. Lastly thanks to the good people on Twitter, who sent me many constructive suggestions for improvement. I still think it's a bit too information dense, but it has come a long way.
Summing up
We looked at two headlines: one clearly well suited for contextualizing through data visualization (longitudinal time series), and another somewhat less so, regarding the composition of the Australian cabinet. In both cases, my understanding of the world has been enriched by the context that data surrounding it provided.
Of course, there are many ways to mislead with graphs, and sparklines can succumb to some of them. The axes are unlabeled, so the time scale is unknown unless specified. Nor is it clear whether or not the y-axis has been deliberately truncated. As a result, it can also be unclear whether or not graphs can be cross-compared. In the cabinet example, I had to explicitly specify that all of the cabinet sparklines have a maximum value of 50% to facilitate this visual comparison, and exposed raw data on mouse hover.
Imagine headlines from your favorite news source enhanced with a bit of longitudinal base rate for context. This would bring more clarity to the news, giving readers a better sense for general trends, as well as putting the event in a broader context. In many cases, the broader context is actually pretty positive: avalanche deaths in controlled areas have gone down drastically, cabinets in many developed nations are becoming more representative.
Some headlines may not fit the mold I'm proposing. Many of them are anecdotal in nature, like gossip stories, where You Won't Believe What Happened, because it's such a unique situation. A certain president doing certain crazy shit comes to mind. For other stories it can be very challenging to acquire the data required, like the Kremlin FSB arrest story. (I may or may not be privy to that sort of information. If I told you, I'd have to kill you.)
One downside to this whole thing is that it requires a journalist to do more work: data sleuthing, careful thought about presentation, possibly even implementing a new visualization. This work has intrinsic value, since it forces the author to broaden their understanding of the subject, and then whittle it down to the substantive kernel for public consumption. But ultimately, just like I really enjoy Pew Research's approach to visualizing polls, headlines with visualizations of relevant base rates would make for a much more informative and interesting read, and ultimately make us better informed citizens. What do you think?